numpy.random.Generator.pareto#
方法
- random.Generator.pareto(a, size=None)#
从具有指定形状的帕累托 II(又称洛马克斯)分布中抽取样本。
- 参数:
- afloat 或 float 的数组类
分布的形状。必须为正数。
- sizeint 或 int 的元组,可选
输出形状。如果给定的形状例如是
(m, n, k),则抽取m * n * k个样本。如果 size 为None(默认值),则当a是标量时,返回单个值。否则,抽取np.array(a).size个样本。
- 返回:
- outndarray 或标量
从帕累托 II 分布抽取的样本。
另请参阅
scipy.stats.pareto帕累托 I 分布
scipy.stats.lomax洛马克斯(帕累托 II)分布
scipy.stats.genpareto广义帕累托分布
备注
帕累托 II 分布的概率密度为
\[p(x) = \frac{a}{(x+1)^{a+1}} , x \ge 0\]其中 \(a > 0\) 是形状参数。
帕累托 II 分布是帕累托 I 分布的移位和缩放版本,后者可在
scipy.stats.pareto中找到。参考
[1]Francis Hunt and Paul Johnson, On the Pareto Distribution of Sourceforge projects.
[2]Pareto, V. (1896). Course of Political Economy. Lausanne.
[3]Reiss, R.D., Thomas, M.(2001), Statistical Analysis of Extreme Values, Birkhauser Verlag, Basel, pp 23-30.
[4]Wikipedia, “Pareto distribution”, https://en.wikipedia.org/wiki/Pareto_distribution
示例
从分布中绘制样本
>>> a = 3.
>>> rng = np.random.default_rng()
>>> s = rng.pareto(a, 10000)
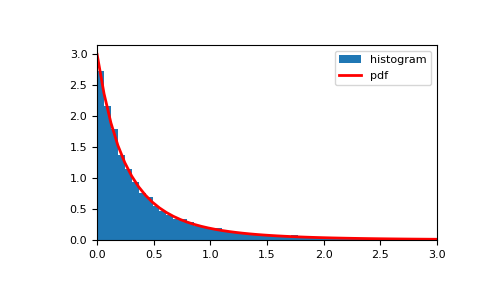
显示样本的直方图以及概率密度函数
>>> import matplotlib.pyplot as plt
>>> x = np.linspace(0, 3, 50)
>>> pdf = a / (x+1)**(a+1)
>>> plt.hist(s, bins=x, density=True, label='histogram')
>>> plt.plot(x, pdf, linewidth=2, color='r', label='pdf')
>>> plt.xlim(x.min(), x.max())
>>> plt.legend()
>>> plt.show()