numpy.random.logseries#
- random.logseries(p, size=None)#
从对数序列分布中抽取样本。
样本从具有指定形状参数
p(0 <=p< 1) 的对数序列分布中抽取。- 参数:
- p浮点数或浮点数数组
分布的形状参数。必须在 [0, 1) 范围内。
- size整数或整数元组,可选
输出形状。例如,如果给定形状为
(m, n, k),则抽取m * n * k个样本。如果size为None(默认),并且p是标量,则返回单个值。否则,抽取np.array(p).size个样本。
- 返回:
- outndarray 或标量
从参数化的对数序列分布中抽取的样本。
另请参阅
scipy.stats.logser概率密度函数、分布或累积密度函数等。
random.Generator.logseries新代码应使用此方法。
备注
对数序列分布的概率密度为
\[P(k) = \frac{-p^k}{k \ln(1-p)},\]其中 p = 概率。
对数序列分布常用于表示物种丰富度和发生情况,最早由 Fisher, Corbet 和 Williams 于 1943 年提出 [2]。它也可用于模拟汽车中观察到的乘员数量 [3]。
参考文献
[1]Buzas, Martin A.; Culver, Stephen J., Understanding regional species diversity through the log series distribution of occurrences: BIODIVERSITY RESEARCH Diversity & Distributions, Volume 5, Number 5, September 1999 , pp. 187-195(9)。
[2]Fisher, R.A,, A.S. Corbet, and C.B. Williams. 1943. The relation between the number of species and the number of individuals in a random sample of an animal population. Journal of Animal Ecology, 12:42-58.
[3]D. J. Hand, F. Daly, D. Lunn, E. Ostrowski, A Handbook of Small Data Sets, CRC Press, 1994。
[4]Wikipedia,“对数分布”,https://en.wikipedia.org/wiki/Logarithmic_distribution
示例
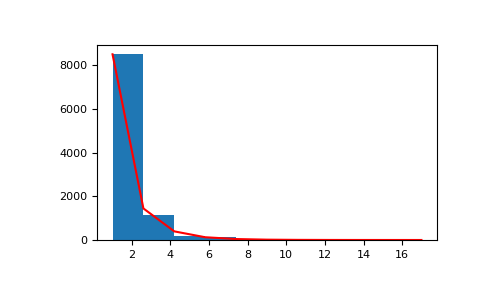
从分布中抽取样本
>>> a = .6
>>> s = np.random.logseries(a, 10000)
>>> import matplotlib.pyplot as plt
>>> count, bins, ignored = plt.hist(s)
# 绘制对抗分布的图
>>> def logseries(k, p):
...     return -p**k/(k*np.log(1-p))
>>> plt.plot(bins, logseries(bins, a)*count.max()/
...          logseries(bins, a).max(), 'r')
>>> plt.show()