numpy.random.Generator.chisquare#
方法
- random.Generator.chisquare(df, size=None)#
从卡方分布中抽取样本。
当 df 个独立的、服从标准正态分布(均值 0,方差 1)的随机变量进行平方和求和时,所得的分布即为卡方分布(参见“注意”)。此分布常用于假设检验。
- 参数:
- df浮点数或浮点数数组
自由度,必须大于 0。
- size整数或整数元组,可选
输出形状。如果给定形状为,例如
(m, n, k),则抽取m * n * k个样本。如果 size 为None(默认值),当df为标量时,将返回单个值。否则,将抽取np.array(df).size个样本。
- 返回:
- outndarray 或标量
从参数化的卡方分布中抽取的样本。
- 抛出:
- ValueError
当 df <= 0 或给定不合适的
size(例如size=-1)时。
注意
通过对 df 个独立的、服从标准正态分布的随机变量的平方求和而获得的变量
\[Q = \sum_{i=1}^{\mathtt{df}} X^2_i\]服从卡方分布,表示为
\[Q \sim \chi^2_k.\]卡方分布的概率密度函数为
\[p(x) = \frac{(1/2)^{k/2}}{\Gamma(k/2)} x^{k/2 - 1} e^{-x/2},\]其中 \(\Gamma\) 是伽马函数,
\[\Gamma(x) = \int_0^{-\infty} t^{x - 1} e^{-t} dt.\]参考文献
[1]NIST “工程统计手册” https://www.itl.nist.gov/div898/handbook/eda/section3/eda3666.htm
示例
>>> rng = np.random.default_rng()
>>> rng.chisquare(2,4)
array([ 1.89920014,  9.00867716,  3.13710533,  5.62318272]) # random
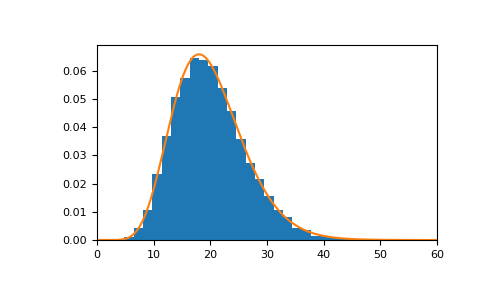
具有 20 个自由度的卡方随机变量的分布如下所示
>>> import matplotlib.pyplot as plt
>>> import scipy.stats as stats
>>> s = rng.chisquare(20, 10000)
>>> count, bins, _ = plt.hist(s, 30, density=True)
>>> x = np.linspace(0, 60, 1000)
>>> plt.plot(x, stats.chi2.pdf(x, df=20))
>>> plt.xlim([0, 60])
>>> plt.show()