使用
fname = "data/2020/numpy_survey_results.tsv"
column_names = [
    'using_random', 'bug', 'bug_resolution', 'bug_resolution_other',
    'unsolvable', 'unsolvable_resolution', 'unsolvable_resolution_other',
    'deprecation', 'deprecation_other'
]
featdep_dtype = np.dtype({
    "names": column_names,
    "formats": ['U1024'] * len(column_names),
})

data = np.loadtxt(
    fname, delimiter='\t', skiprows=3, dtype=featdep_dtype,
    usecols=range(87, 96), comments=None
)
本节包含各种问题,旨在深入了解新功能的采用、问题的解决以及弃用周期的长短等方面。
新的 numpy.random 采用情况
NumPy 1.17 版本在 numpy.random 中添加了用于随机数生成的新 API。我们询问了调查参与者是否正在使用新的随机 API。在 1236 名调查参与者中,有 596 名(48%)分享了他们是否正在使用新的 random API。
rand = data['using_random'][data['using_random'] != '']
labels, cnts = np.unique(rand, return_counts=True)

fig, ax = plt.subplots(figsize=(8, 8))
ax.pie(cnts, labels=labels, autopct='%1.1f%%')
fig.tight_layout()

glue(
    'num_random_users',
    gluval(rand.shape[0], data.shape[0]),
    display=False
)
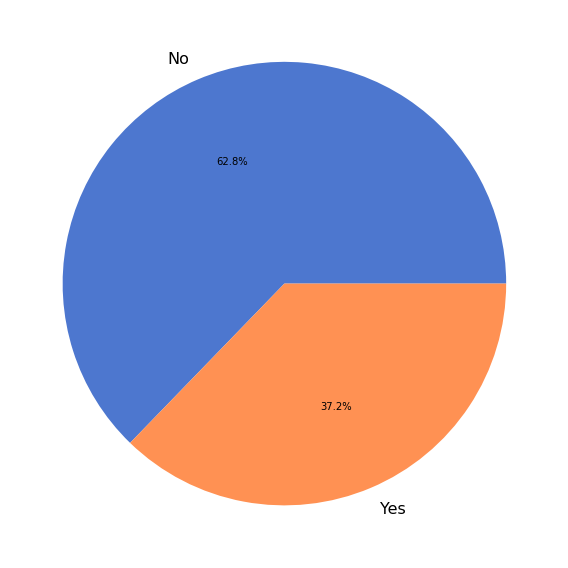
处理问题
我们想了解用户遇到 NumPy 问题的频率,因此我们提出了以下问题
在过去一年中,您是否在自己编写的代码中遇到过源于 NumPy 问题的问题?
在 1236 名调查参与者中,有 885 名(72%)回答了这个问题。
bug = data['bug'][data['bug'] != '']
labels, cnts = np.unique(bug, return_counts=True)

fig, ax = plt.subplots(figsize=(8, 8))
ax.pie(cnts, labels=labels, autopct='%1.1f%%', labeldistance=None)
ax.legend()
fig.tight_layout()

glue(
    'bug_reporters',
    gluval(bug.shape[0], data.shape[0]),
    display=False,
)
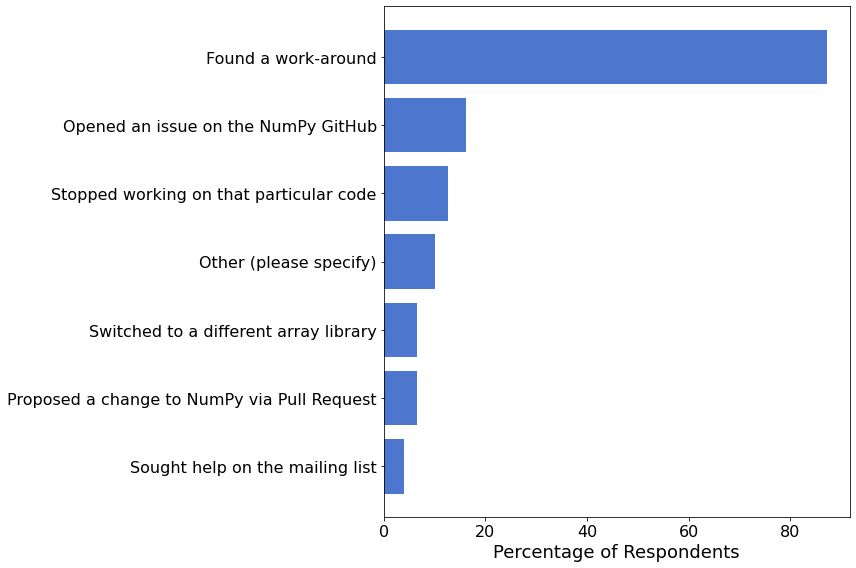
我们询问了那些报告遇到问题的人,他们采取了哪些措施来解决问题。
bug_resolution = data['bug_resolution'][data['bug_resolution'] != '']
labels, cnts = np.unique(flatten(bug_resolution), return_counts=True)
I = np.argsort(cnts)
labels, cnts = labels[I], cnts[I]

fig, ax = plt.subplots(figsize=(12, 8))
ax.barh(
    np.arange(len(labels)),
    100 * cnts / bug_resolution.shape[0],
    tick_label=labels,
)
ax.set_xlabel('Percentage of Respondents')
fig.tight_layout()
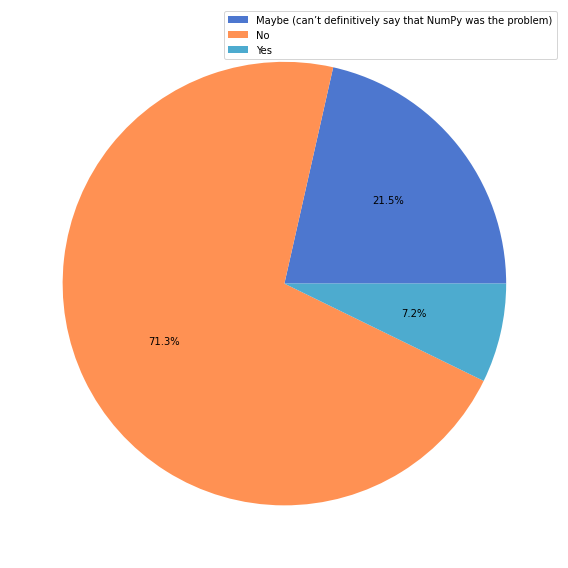
使用 NumPy 进行数据分析
与上一个问题类似,我们试图了解 NumPy 在多大程度上满足了用户的数据分析需求。我们提出了以下问题
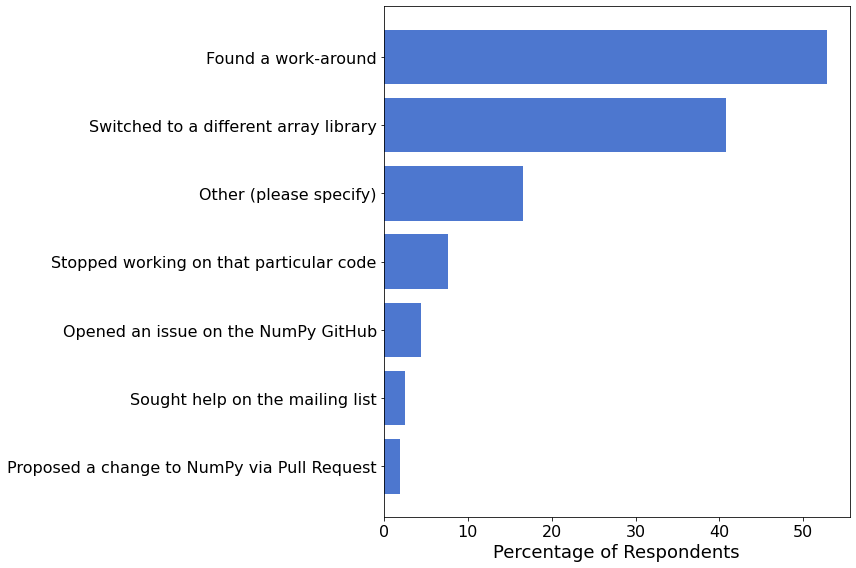
在过去一年中,您是否遇到过涉及数值数据,但无法使用 NumPy 解决的问题?
在 1236 名调查参与者中,有 874 名(71%)回答了上述问题,其中 164 名(19%)表示他们遇到过最初预期能使用 NumPy 解决,但未能解决的问题。
unsolvable = data['unsolvable'][data['unsolvable'] != '']
labels, cnts = np.unique(unsolvable, return_counts=True)
num_yes = np.sum(unsolvable == 'Yes')

fig, ax = plt.subplots(figsize=(8, 8))
ax.pie(cnts, labels=labels, autopct='%1.1f%%')
fig.tight_layout()

glue(
    'num_solvers',
    gluval(unsolvable.shape[0], data.shape[0]),
    display=False,
)
glue(
    'num_unsolved',
    gluval(num_yes, unsolvable.shape[0]),
    display=False
)

我们询问了那些对上一个问题回答“是”的人,他们采取了哪些措施来解决问题。
resolution = data['unsolvable_resolution'][data['unsolvable'] == 'Yes']
resolution = resolution[resolution != '']
labels, cnts = np.unique(flatten(resolution), return_counts=True)
I = np.argsort(cnts)
labels, cnts = labels[I], cnts[I]

fig, ax = plt.subplots(figsize=(12, 8))
ax.barh(
    np.arange(len(labels)),
    100 * cnts / resolution.shape[0],
    tick_label=labels,
)
ax.set_xlabel('Percentage of Respondents')
fig.tight_layout()
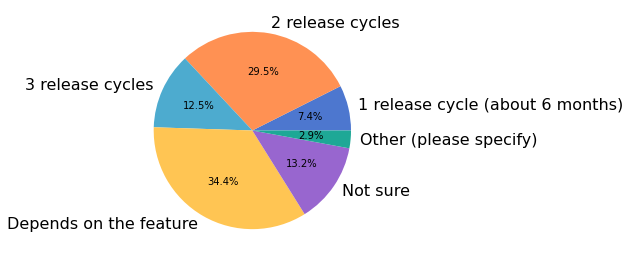
弃用时间范围
我们请调查参与者分享他们对 NumPy 弃用周期的看法,具体来说是
您认为多长时间是一个合适的弃用时间范围?
在 1236 名调查参与者中,有 863 名(70%)回答了这个问题。
depcycle = data['deprecation'][data['deprecation'] != '']
labels, cnts = np.unique(depcycle, return_counts=True)

fig, ax = plt.subplots(figsize=(8, 8))
ax.pie(cnts, labels=labels, autopct='%1.1f%%')
fig.tight_layout()

glue(
    'dep_opinions',
    gluval(depcycle.shape[0], data.shape[0]),
    display=False
)