社区
NumPy 调查受访者人口统计信息的总结。
fname = "data/2021/numpy_survey_results.tsv"
column_names = [
    'age', 'gender', 'lang', 'lang_other', 'country', 'degree', 'degree_other',
    'field_of_study', 'field_other', 'role', 'role_other', 'version', 'version_other',
    'primary_use', 'share_code', 'programming_exp', 'numpy_exp', 'use_freq', 'components',
    'use_c_ext', 'prog_lang', 'prog_lang_other', 'surv2020'
]
demographics_dtype = np.dtype({
    "names": column_names,
    "formats": ['<U600'] * len(column_names),
})

data = np.loadtxt(
    fname, delimiter='\t', skiprows=3, dtype=demographics_dtype,
    usecols=list(range(11, 33)) + [90], comments=None, encoding='UTF-16'
)

glue('2021_num_respondents', data.shape[0], display=False)
人口统计信息
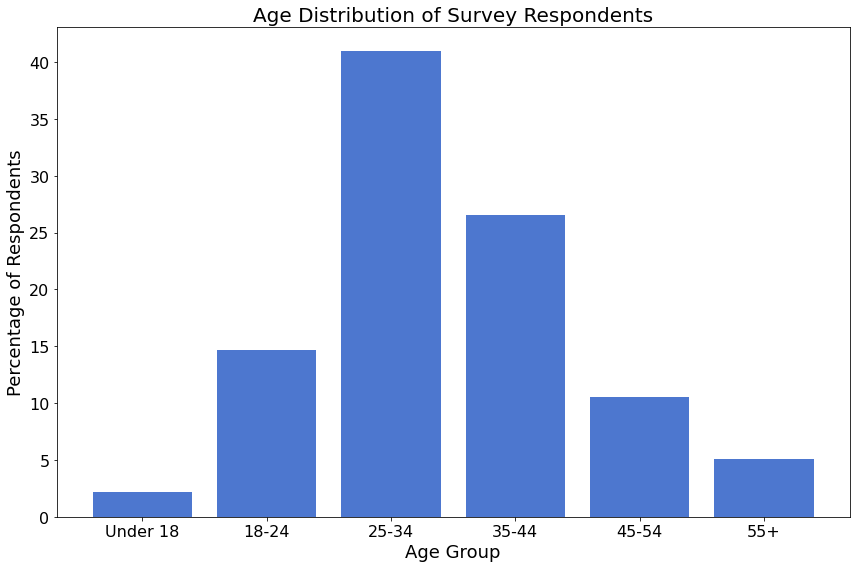
年龄
在 522 名调查受访者中,456 人(87%)分享了他们的年龄。
大多数受访者年龄介于 25-34 岁和 35-44 岁之间。很少有受访者年龄超过 55 岁,更少有受访者年龄低于 18 岁。
# Ignore empty fields and "prefer not to answer"
drop = np.logical_and(data['age'] != '', data['age'] != 'Prefer not to answer')
age = data['age'][drop]
labels, cnts = np.unique(age, return_counts=True)
ind = np.array([5,0,1,2,3,4])
labels, cnts = labels[ind], cnts[ind]

fig, ax = plt.subplots(figsize=(12, 8))
ax.bar(
  np.arange(len(labels)),
  100 * cnts / age.shape[0],
  tick_label=labels,
)
ax.set_ylabel('Percentage of Respondents')
ax.set_xlabel('Age Group')
ax.set_title("Age Distribution of Survey Respondents");
fig.tight_layout()

glue('2021_num_age_respondents', gluval(age.shape[0], data.shape[0]), display=False)
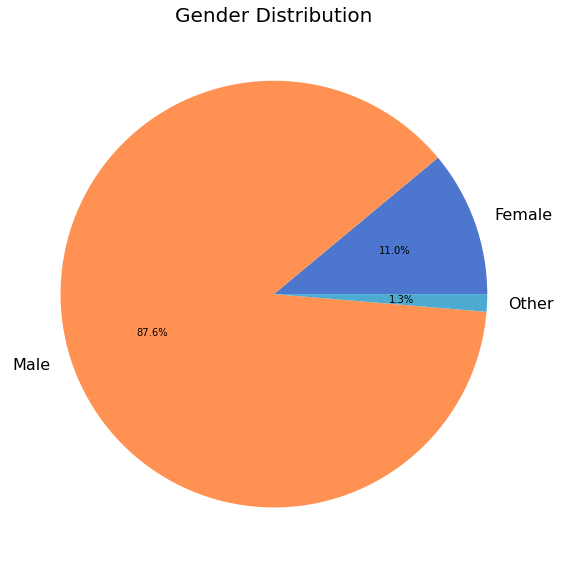
性别
在 522 名调查受访者中,453 人(87%)分享了他们的性别。
绝大多数受访者认同自己是男性。只有约 11% 的受访者认同自己是女性。
# Ignore empty fields and "prefer not to answer"
drop = np.logical_and(data['gender'] != '', data['gender'] != 'Prefer not to answer')
gender = data['gender'][drop]
labels, cnts = np.unique(gender, return_counts=True)

fig, ax = plt.subplots(figsize=(8, 8))
ax.pie(cnts, labels=labels, autopct='%1.1f%%')
ax.set_title("Gender Distribution");
fig.tight_layout()

glue('2021_num_gender', gluval(gender.shape[0], data.shape[0]), display=False)
语言偏好
在 522 名受访者中,497 人(95%)分享了他们的首选语言。
超过 67% 的受访者报告英语是他们的首选语言。
# Ignore empty fields
lang = data['lang'][data['lang'] != '']
# Self-reported language
lang_other = data['lang_other'][data['lang_other'] != '']
lang_other = capitalize(lang_other)
lang = np.concatenate((lang, lang_other))
labels, cnts = np.unique(lang, return_counts=True)
cnts = 100 * cnts / cnts.sum()
I = np.argsort(cnts)[::-1]
labels, cnts = labels[I], cnts[I]

# Create a summary table
with open('_generated/language_preference_table.md', 'w') as of:
    of.write('| **Language** | **Preferred by % of Respondents** |\n')
    of.write('|--------------|-----------------------------------|\n')
    for lbl, percent in zip(labels, cnts):
        of.write(f'| {lbl} | {percent:1.1f} |\n')

glue('2021_num_lang_pref', gluval(lang.shape[0], data.shape[0]), display=False)
点击显示/隐藏表格
语言 |
受访者偏好百分比 |
|---|---|
英语 |
67.2 |
其他 |
6.6 |
西班牙语 |
6.2 |
法语 |
5.4 |
日语 |
5.0 |
俄语 |
1.8 |
德语 |
1.4 |
普通话 |
1.0 |
葡萄牙语 |
0.6 |
波兰语 |
0.6 |
瑞典语 |
0.4 |
捷克语 |
0.4 |
意大利语 |
0.4 |
土耳其语 |
0.4 |
中文 (Chinise) |
0.2 |
中文 |
0.2 |
中文 (Chinese) |
0.2 |
保加利亚语 |
0.2 |
德语 (Allemand) |
0.2 |
匈牙利语 |
0.2 |
荷兰语 |
0.2 |
希伯来语 |
0.2 |
印地语 |
0.2 |
印度尼西亚语 |
0.2 |
韩语 |
0.2 |
挪威语 |
0.2 |
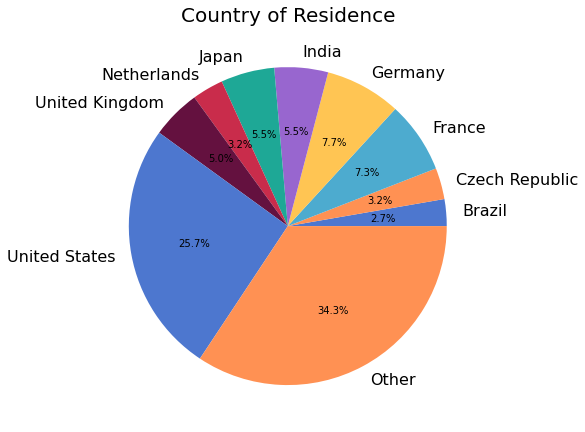
居住国家
在 522 名受访者中,440 人(84%)分享了他们目前的居住国家。本次调查共收到了来自 54 个国家的受访者。四分之一的受访者居住在美国。
下表显示了参与人数最多的约 10 个国家的受访者相对数量。出于隐私原因,参与人数少于特定数量的国家未包含在图中,而是在随后的表格中列出。
# Preprocess data
country = data['country'][data['country'] != '']
country = strip(country)
# Distribution
labels, cnts = np.unique(country, return_counts=True)
# Privacy filter
num_resp = 10
cutoff = (cnts > num_resp)
plabels = np.concatenate((labels[cutoff], ['Other']))
pcnts = np.concatenate((cnts[cutoff], [cnts[~cutoff].sum()]))

# Plot
fig, ax = plt.subplots(figsize=(8, 8))
ax.pie(pcnts, labels=plabels, autopct='%1.1f%%')
ax.set_title("Country of Residence");
fig.tight_layout()

# Map countries to continents
import pycountry_convert as pc
cont_code_to_cont_name = {
    'NA': 'North America',
    'SA': 'South America',
    'AS': 'Asia',
    'EU': 'Europe',
    'AF': 'Africa',
    'OC': 'Oceania',
}
def country_to_continent(country_name):
    cc = pc.country_name_to_country_alpha2(country_name)
    cont_code = pc.country_alpha2_to_continent_code(cc)
    return cont_code_to_cont_name[cont_code]
c2c = np.vectorize(country_to_continent, otypes='U')

# Organize countries below the privacy cutoff by their continent
remaining_countries = labels[~cutoff]
continents = c2c(remaining_countries)
with open('_generated/countries_by_continent.md', 'w') as of:
    of.write('|  |  |\n')
    of.write('|---------------|-------------|\n')
    for continent in np.unique(continents):
        clist = remaining_countries[continents == continent]
        of.write(f"| **{continent}:** | {', '.join(clist)} |\n")

glue('2021_num_unique_countries', len(labels), display=False)
glue(
    '2021_num_country_respondents',
    gluval(country.shape[0], data.shape[0]),
    display=False
)
非洲 |
埃及、加纳、肯尼亚、尼日利亚、南非、津巴布韦 |
亚洲 |
孟加拉国、中国、印度尼西亚、以色列、马来西亚、巴基斯坦、新加坡、韩国、土耳其 |
欧洲 |
奥地利、比利时、保加利亚、丹麦、芬兰、匈牙利、冰岛、爱尔兰、意大利、拉脱维亚、挪威、波兰、俄罗斯、斯洛伐克、西班牙、瑞典、瑞士、乌克兰 |
北美洲 |
加拿大、古巴、墨西哥 |
大洋洲 |
澳大利亚、瓦努阿图 |
南美洲 |
阿根廷、智利、哥伦比亚、厄瓜多尔、巴拉圭、秘鲁、委内瑞拉 |
教育程度
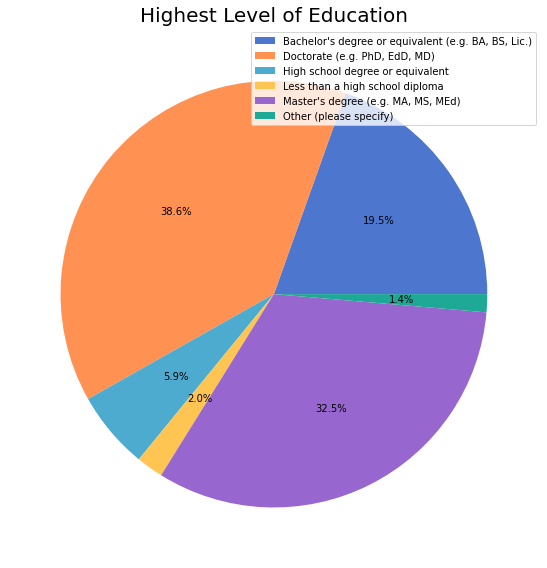
440 名(84%)受访者分享了他们的教育背景,涵盖了从高中毕业前到博士学位以及许多其他专业学位。
通常,受访者受教育程度较高。十分之九的人至少拥有学士学位,三分之一的人拥有博士学位。
下图总结了受访者获得的最高学位的分布情况。
degree = data['degree'][data['degree'] != '']
labels, cnts = np.unique(degree, return_counts=True)

fig, ax = plt.subplots(figsize=(8, 8))
ax.pie(cnts, labels=labels, autopct='%1.1f%%', labeldistance=None)
ax.legend()
ax.set_title("Highest Level of Education");
fig.tight_layout()

glue('2021_num_education', gluval(degree.shape[0], data.shape[0]), display=False)
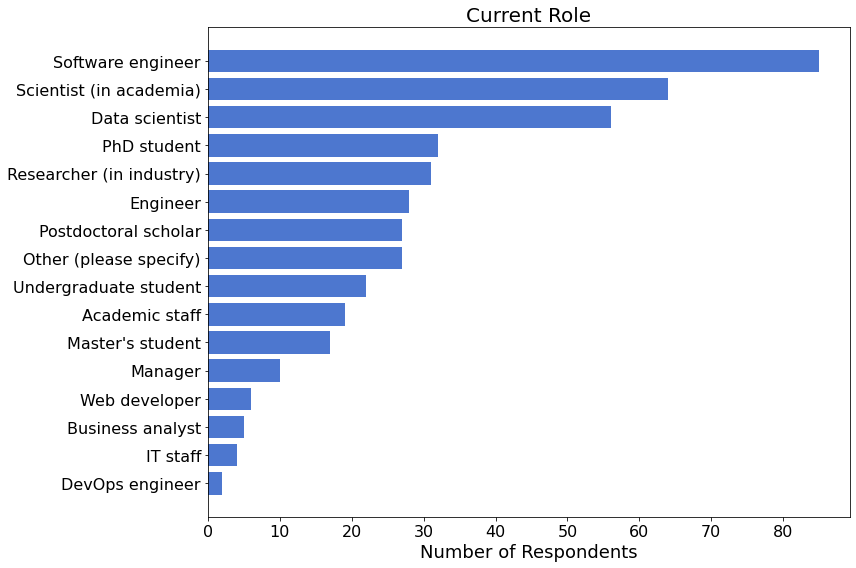
职业角色
在 435 名分享职业的受访者中,有 205 人(47%)认同自己是数据科学家、科学家(学术界)或软件工程师。
role = data['role'][data['role'] != '']
labels, cnts = np.unique(role, return_counts=True)

# Sort results by number of selections
inds = np.argsort(cnts)
labels, cnts = labels[inds], cnts[inds]

fig, ax = plt.subplots(figsize=(12, 8))
ax.barh(np.arange(len(cnts)), cnts, align='center')
ax.set_yticks(np.arange(len(cnts)))
ax.set_yticklabels(labels)
ax.set_xlabel("Number of Respondents")
ax.set_title("Current Role");
fig.tight_layout()

glue('2021_num_occupation', role.shape[0], display=False)
glue(
    '2021_num_top_3_categories',
    gluval(cnts[-3:].sum(), role.shape[0]),
    display=False,
)
glue('2021_top_3_categories', f"{labels[-3]}, {labels[-2]}, or {labels[-1]}", display=False)
2020 年社区调查受访者
4 名(1%)受访者分享了他们是否参与了 2020 年社区调查。只有 25.0% 的人报告完成了去年的调查。
# Ignore empty fields and "prefer not to answer"
drop = np.logical_and(data['surv2020'] != '', data['surv2020'] != 'Not sure')
surv2020 = data['surv2020'][drop]
labels, cnts = np.unique(surv2020, return_counts=True)

glue('2021_num_surv2020_respondents', gluval(surv2020.shape[0], data.shape[0]), display=False)
yes_percent = 100 * cnts[1].sum() / cnts.sum()
glue('2021_yes_percent', f"{yes_percent:1.1f}", display=False)
经验与使用情况
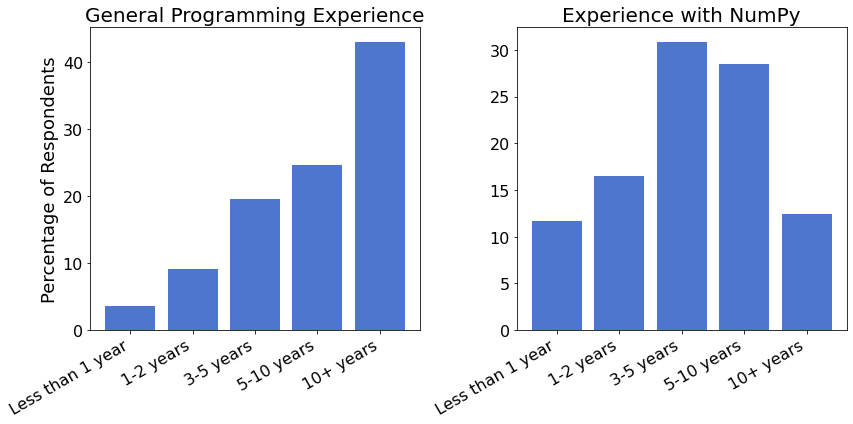
编程经验
68% 的受访者拥有丰富的编程经验,其中资深用户(10 年以上)占主导地位。有趣的是,在使用 NumPy 方面,我们的受访者中新手明显多于经验丰富的用户。
fig, axes = plt.subplots(1, 2, figsize=(12, 6))
# Ascending order for figure
ind = np.array([-1, 0, 2, 3, 1])
for exp_data, ax in zip(('programming_exp', 'numpy_exp'), axes):
    # Analysis
    prog_exp = data[exp_data][data[exp_data] != '']
    labels, cnts = np.unique(prog_exp, return_counts=True)
    cnts = 100 * cnts / cnts.sum()
    labels, cnts = labels[ind], cnts[ind]
    # Generate text on general programming experience
    glue(f'2021_{exp_data}_5plus_years', f"{cnts[-2:].sum():2.0f}%", display=False)
    # Plotting
    ax.bar(np.arange(len(cnts)), cnts)
    ax.set_xticks(np.arange(len(cnts)))
    ax.set_xticklabels(labels)
axes[0].set_title('General Programming Experience')
axes[0].set_ylabel('Percentage of Respondents')
axes[1].set_title('Experience with NumPy');
fig.autofmt_xdate();
fig.tight_layout();
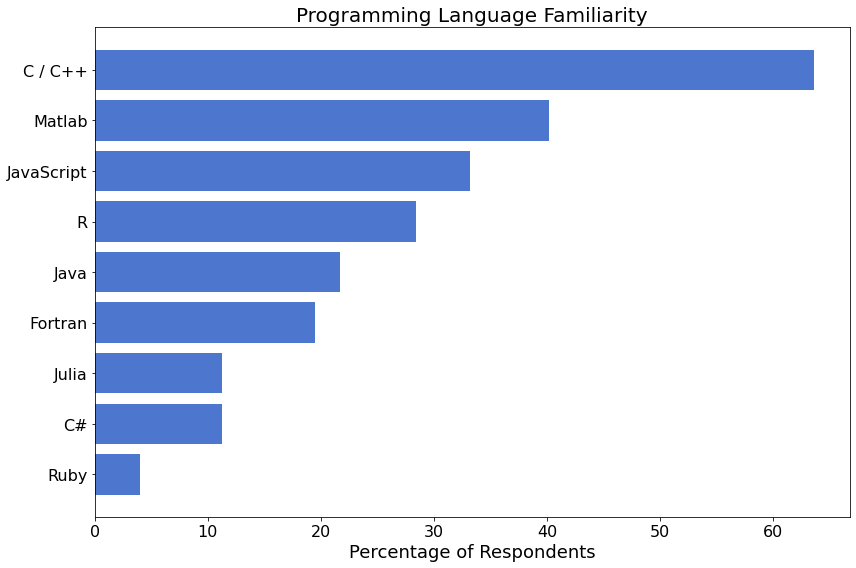
编程语言
401 名(77%)调查参与者分享了他们使用其他编程语言的经验。64% 的受访者熟悉 C / C++,40% 熟悉 Matlab。
pl = data['prog_lang'][data['prog_lang'] != '']
num_respondents = len(pl)
glue('2021_num_proglang_respondents', gluval(len(pl), data.shape[0]), display=False)

# Flatten & remove 'Other' write-in option
other = 'Other (please specify, using commas to separate individual entries)'
apl = []
for row in pl:
    if 'Other' in row:
        row = ','.join(row.split(',')[:-2])
        if len(row) < 1:
            continue
    apl.extend(row.split(','))
labels, cnts = np.unique(apl, return_counts=True)
cnts = 100 * cnts / num_respondents
I = np.argsort(cnts)
labels, cnts = labels[I], cnts[I]

fig, ax = plt.subplots(figsize=(12, 8))
ax.barh(np.arange(len(cnts)), cnts, align='center')
ax.set_yticks(np.arange(len(cnts)))
ax.set_yticklabels(labels)
ax.set_xlabel("Percentage of Respondents")
ax.set_title("Programming Language Familiarity")
fig.tight_layout()

# Highlight two most popular
glue('2021_num_top_lang', f"{cnts[-1]:2.0f}%", display=False)
glue('2021_top_lang', labels[-1], display=False)
glue('2021_num_2nd_lang', f"{cnts[-2]:2.0f}%", display=False)
glue('2021_second_lang', labels[-2], display=False)
84 名(21%)受访者表示熟悉上述列表之外的其他计算机语言。其中,Rust 最受欢迎,有 17 名(4%)受访者使用该语言。其他报告的语言列表可在下方找到(点击展开)。
['"' '"cobol' '"tcl' '-' 'amigae' 'asembler mc68k' 'asembler x86'
 'assembly' 'awk' 'bash' 'basic' 'clojure' 'cython' 'dart' 'dpl' 'elixir'
 'elm' 'f#' 'forth' 'go' 'golang' 'haskel' 'haskell' 'idl' 'kotlin' 'lisp'
 'llvm ir' 'logo' 'lua' 'mathematica' 'matlab' 'mysql' 'nim' 'nim lang'
 'nix' 'none' 'none except python' 'objective-c' 'ocaml' 'pascal' 'perl'
 'php' 'prolog' 'python' 'rust' 'scala' 'scheme' 'shell' 'sql' 'stata'
 'swift' 'systemverilog' 't-sql' 'tcl' 'tcl/tk' 'tex' 'typescript' 'vba'
 'verilog' 'visual basic' 'visual foxpro' 'what does familiar mean?'
 'wolfram']
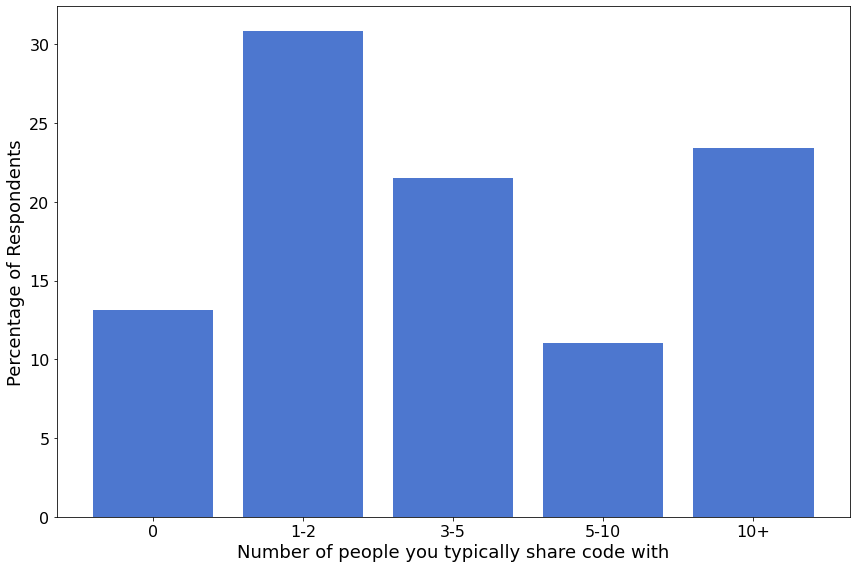
代码共享
418 名(80%)调查参与者分享了他们通常与多少人共享代码的信息。大多数受访者与 1-2 人共享代码。
from numpy_survey_results.utils import flatten

share_code = data['share_code'][data['share_code'] != '']
labels, cnts = np.unique(flatten(share_code), return_counts=True)

# Sort categories in ascending order (i.e. "0", "1-2", "3-5", "5-10", "10+")
ind = np.array([0, 1, 3, 4, 2])
labels, cnts = labels[ind], cnts[ind]

fig, ax = plt.subplots(figsize=(12, 8))
ax.bar(
    np.arange(len(labels)),
    100 * cnts / share_code.shape[0],
    tick_label=labels,
)
ax.set_ylabel('Percentage of Respondents')
ax.set_xlabel('Number of people you typically share code with')
fig.tight_layout()

# Highlights most popular
glue('2021_top_share', labels[np.argmax(cnts)], display=False)

# Number who answered question
glue(
    '2021_num_share_code',
    gluval(share_code.shape[0], data.shape[0]),
    display=False
)