贡献
与许多开源项目一样,NumPy 主要依靠社区贡献来维护和改进。本次调查的目的之一是更多地了解 NumPy 用户作为 NumPy 和其他开源项目贡献者的经验和动机。
# Load data related to open-source contributions *other* than NumPy

fname = "data/2021/numpy_survey_results.tsv"
column_names = [
    'contributed', 'projects', 'projects_other', 'contr_type',
    'contr_type_other', 'regular', 'how_got_started', 'how_got_started_other',
    'interested', 'limitations'
]
nonnumpy_contributions_dtype = np.dtype({
    "names": column_names,
    "formats": ['<U1024'] * len(column_names),
})

ossdata = np.loadtxt(
    fname, delimiter='\t', skiprows=3, dtype=nonnumpy_contributions_dtype,
    usecols=range(33, 44), comments=None, encoding='UTF-16'
)
# Load data related to NumPy contributions
column_names = [
    'contributed', 'contr_type', 'contr_type_other', 'regular',
    'how_got_started', 'how_got_started_other', 'motivations',
    'motivations_other', 'continue', 'limitations', 'limitations_other',
    'interested', 'interests', 'interests_other'
]

numpy_contributions_dtype = np.dtype({
    "names": column_names,
    "formats": ['<U1024'] * len(column_names),
})

npdata = np.loadtxt(
    fname, delimiter='\t', skiprows=3, dtype=numpy_contributions_dtype,
    usecols=range(44, 59), comments=None, encoding='UTF-16'
)
assert npdata.shape[0] == ossdata.shape[0]  # Sanity check on data
# Selection criteria for subsequent analysis
oss_contributors_mask = ossdata['contributed'] == 'Yes'
np_contributors_mask = npdata['contributed'] == 'Yes'
# Compute some basic parameters on OSS/np-specific contributions
num_respondents = npdata.shape[0]
num_oss_contributors = oss_contributors_mask.sum()
num_np_contributors = np_contributors_mask.sum()
num_both_contributors = np.sum(oss_contributors_mask & np_contributors_mask)
# Compute fraction of regular contributors.
num_oss_regular = np.sum(ossdata['regular'][oss_contributors_mask] == 'Yes')
num_np_regular = np.sum(npdata['regular'][np_contributors_mask] == 'Yes')
# Links for report
glue(
    '2021_oss_contributors',
    gluval(num_oss_contributors, num_respondents),
    display=False
)
glue(
    '2021_np_contributors',
    gluval(num_np_contributors, num_respondents),
    display=False
)
glue(
    '2021_numpy_and_oss_contributors',
    gluval(num_both_contributors, num_np_contributors),
    display=False
)
glue(
    '2021_oss_regulars',
    gluval(num_oss_regular, num_oss_contributors),
    display=False
)
glue(
    '2021_np_regulars',
    gluval(num_np_regular, num_np_contributors),
    display=False
)
NumPy 和开源软件贡献者
在 522 名调查参与者中,197 人 (38%) 至少为一个开源软件项目做出过贡献,其中 46 人 (9%) 专门为 NumPy 做出过贡献。在开源软件贡献者中,68 人 (35%) 目前1是至少一个开源软件项目的常规贡献者,而在 NumPy 贡献者中,15 人 (33%) 定期为 NumPy 贡献。反映其在科学 Python 生态系统中的核心地位,41 名 (89%) NumPy 贡献者表示也为其他开源软件项目做出了贡献。
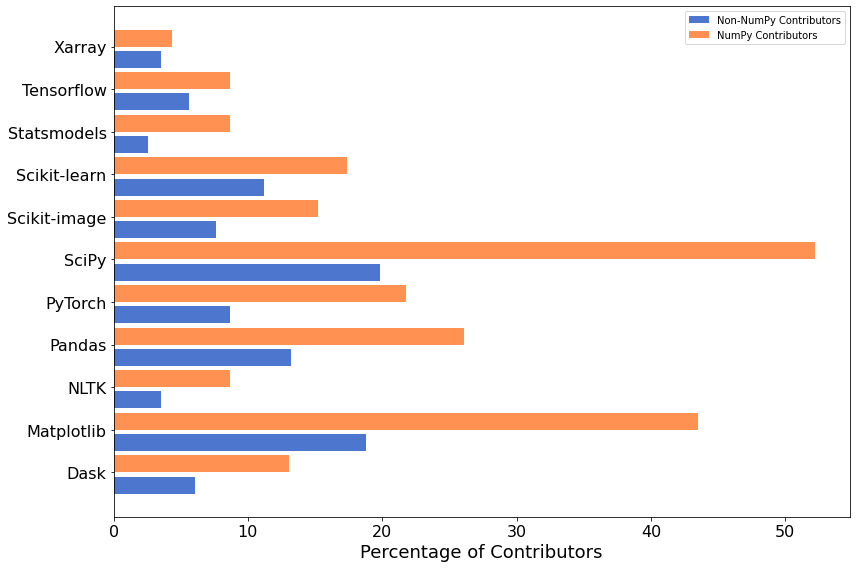
开源软件贡献
下图显示了在各种流行科学 Python 项目上工作的贡献者比例。
# Remove less-popular projects
projects_to_drop = (
    'Gensim', 'spaCy', '', 'CuPy', 'PyMC3',
    'Other (please specify - use commas to separate multiple entries)'
)

fig, ax = plt.subplots(figsize=(12, 8))
for (start_ind, mask, label) in zip(
    (0, 1),
    (oss_contributors_mask, np_contributors_mask),
    ('Non-NumPy Contributors', 'NumPy Contributors')
):
    project_data = flatten(ossdata['projects'][mask])
    labels, cnts = np.unique(project_data, return_counts=True)
    # Projects to drop from all datasets
    for proj in projects_to_drop:
        drop = (labels != proj)
        labels, cnts = labels[drop], cnts[drop]
    # Plot
    ax.barh(
        np.arange(start_ind, 2 * len(labels), 2),
        100 * cnts / mask.sum(),
        align='edge',
        label=label,
    )
ax.set_yticks(np.arange(start_ind, 2 * len(labels), 2))
ax.set_yticklabels(labels)
ax.set_xlabel('Percentage of Contributors')
ax.legend()
fig.tight_layout()
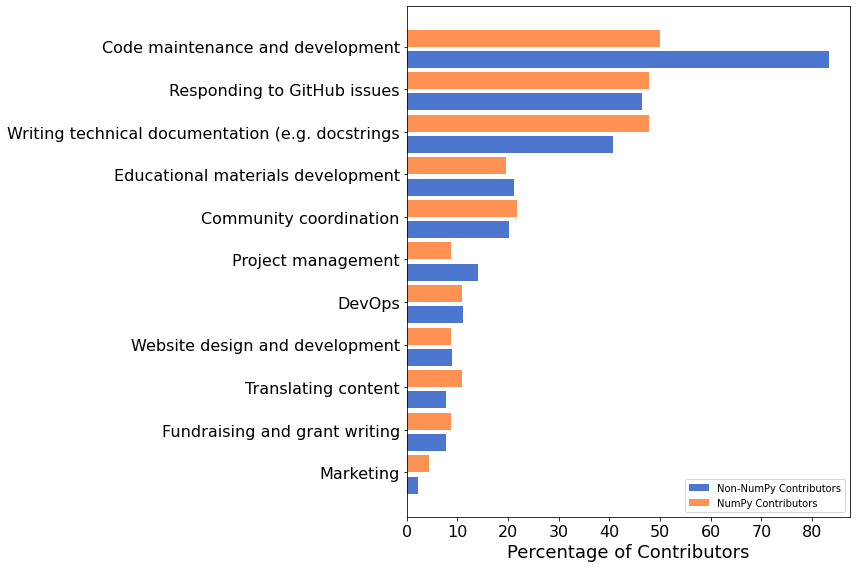
贡献类型
我们还询问了人们
fig, ax = plt.subplots(figsize=(12, 8))

# Sort order for categories - computed in loop and kept consistent for both datasets
I = None

for start_ind, (data, mask, label, key) in enumerate(zip(
    (ossdata, npdata),
    (oss_contributors_mask, np_contributors_mask),
    ('Non-NumPy Contributors', 'NumPy Contributors'),
    ('oss', 'np'),
)):
    how_data = data['contr_type'][mask]
    # Remove non-responses
    how_data = how_data[how_data != '']
    data = flatten(how_data)
    # Remove "Other" category
    data = np.asarray(data)
    data = data[data != 'Other (please specify)']
    labels, cnts = np.unique(data, return_counts=True)
    # Ignore duplicate labels from bad split
    labels, cnts = labels[2:], cnts[2:]
    # Apply category ordering
    I = np.argsort(cnts) if I is None else I
    labels, cnts = labels[I], cnts[I]

    # Plot
    ax.barh(
        np.arange(start_ind, 2 * len(labels), 2),
        100 * cnts / len(how_data),
        align='edge',
        label=label,
    )

    # Highlight code and docs results for Q1 and Q2
    code_contr = cnts[labels == 'Code maintenance and development'][0]
    doc_contr = cnts[labels == 'Writing technical documentation (e.g. docstrings'][0]
    glue(
        f'2021_pct_contrib_{key}_code',
        f"{100 * code_contr / mask.sum():2.0f}%",
        display=False,
    )
    glue(
        f'2021_pct_contrib_{key}_docs',
        f"{100 * doc_contr / mask.sum():2.0f}%",
        display=False,
    )

ax.set_yticks(np.arange(start_ind, 2 * len(labels), 2))
ax.set_yticklabels(labels)
ax.set_xlabel('Percentage of Contributors')
ax.legend(loc=4)
fig.tight_layout()
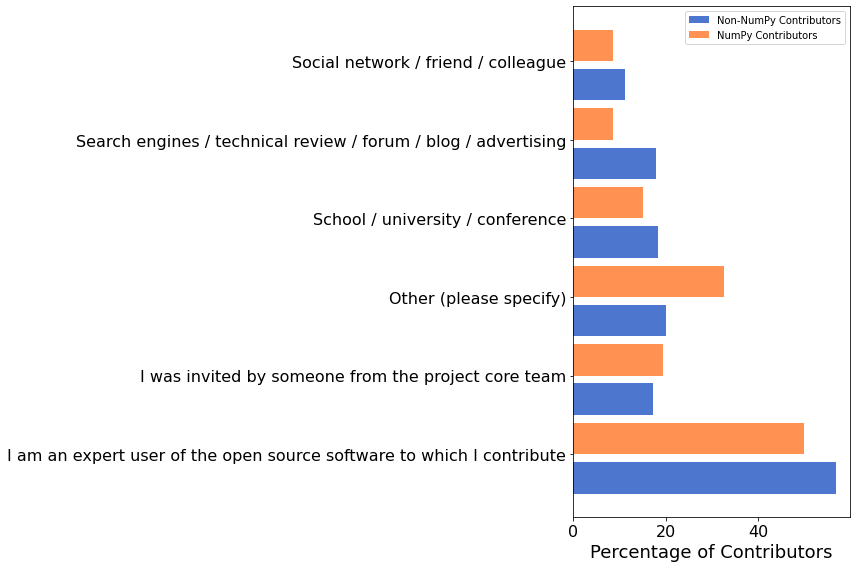
贡献者是如何开始的?
我们还询问了贡献者是如何开始参与他们所贡献的开源软件包的
fig, ax = plt.subplots(figsize=(12, 8))
for start_ind, (data, mask, label) in enumerate(zip(
    (ossdata, npdata),
    (oss_contributors_mask, np_contributors_mask),
    ('Non-NumPy Contributors', 'NumPy Contributors')
)):
    how_data = data['how_got_started'][mask]
    # Remove non-responses
    how_data = how_data[how_data != '']
    data = flatten(how_data)
    labels, cnts = np.unique(data, return_counts=True)
    # Plot
    ax.barh(
        np.arange(start_ind, 2 * len(labels), 2),
        100 * cnts / len(how_data),
        align='edge',
        label=label,
    )
ax.set_yticks(np.arange(start_ind, 2 * len(labels), 2))
ax.set_yticklabels(labels)
ax.set_xlabel('Percentage of Contributors')
ax.legend()
fig.tight_layout()
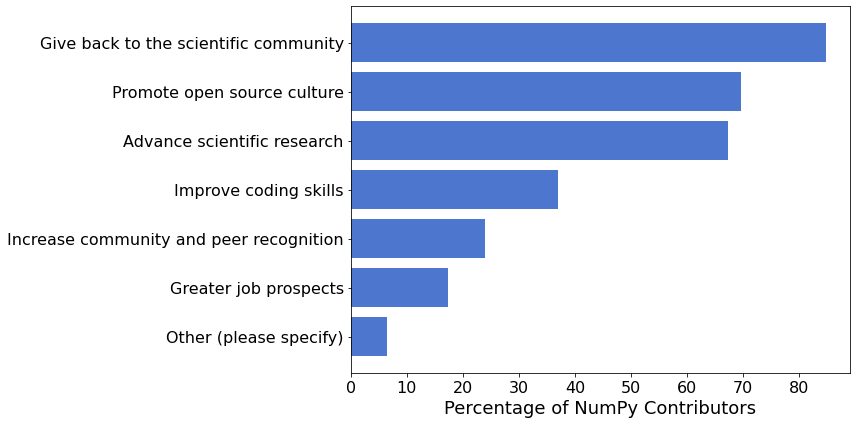
动机
促进科学研究、推广开源文化和回馈科学社区是受访者为 NumPy 做出贡献的前三大原因。
# NumPy data only, no need to apply np/oss masks
motivations = npdata['motivations'][npdata['motivations'] != '']
labels, cnts = np.unique(flatten(motivations), return_counts=True)
I = np.argsort(cnts)
labels, cnts = labels[I], cnts[I]

fig, ax = plt.subplots(figsize=(12, 6))
ax.barh(np.arange(len(labels)), 100 * cnts / len(motivations))
ax.set_yticks(np.arange(len(labels)))
ax.set_yticklabels(labels)
ax.set_xlabel('Percentage of NumPy Contributors')
fig.tight_layout()

# Highlight top 3
glue('2021_top_3_motivations', f"{labels[-3]}, {labels[-2]}, and {labels[-1]}", display=False)
留存
最后,我们询问了 NumPy 贡献者是否计划继续为 NumPy 做出贡献。在自认为是 NumPy 常规贡献者的调查参与者中,15 人 (100%) 计划继续贡献。在不认为自己是
np_regular_mask = npdata['regular'] == 'Yes'
regular_continue = npdata['continue'][np_regular_mask] == 'Yes'
glue(
    '2021_regular_continue_pct',
    gluval(regular_continue.sum(), np_regular_mask.sum()),
    display=False
)
non_regular_contributor_mask = (np_contributors_mask) & (~np_regular_mask)
glue(
    '2021_num_nonregular_np_contributors',
    non_regular_contributor_mask.sum(),
    display=False
)
num_nonregular_continue = np.sum(
    npdata['continue'][non_regular_contributor_mask] == 'Yes'
)
glue(
    '2021_become_regular_pct',
    f'{100 * num_nonregular_continue / non_regular_contributor_mask.sum():1.0f}%',
    display=False
)
尚未(但可能)贡献的用户
我们还想了解尚未直接贡献于项目(包括 NumPy 和其他开源软件)的 NumPy(和其他开源软件)用户的看法——他们通常有兴趣这样做吗?对于想回馈的用户来说,最大的绊脚石是什么?在 522 名调查受访者中,197 人 (38%) 报告从未贡献过开源软件项目,328 人 (63%) 报告从未专门为 NumPy 贡献过。
num_oss_non_contributors = np.sum(ossdata['contributed'] == 'No')
num_np_non_contributors = np.sum(npdata['contributed'] == 'No')
glue(
    '2021_oss_non_contributors',
    gluval(num_oss_non_contributors, num_respondents),
    display=False
)
glue(
    '2021_np_non_contributors',
    gluval(num_np_non_contributors, num_respondents),
    display=False
)
贡献意愿
我们询问这些受访者是否有兴趣为他们使用的开源软件包做出贡献。157 人 (80%) 表示他们普遍对为开源软件做贡献感兴趣,而 196 人 (60%) 专门对为 NumPy 做贡献感兴趣。
oss_interested_mask = (ossdata['contributed'] == 'No') & (ossdata['interested'] == 'Yes')
np_interested_mask = (npdata['contributed'] == 'No') & (npdata['interested'] == 'Yes')
glue(
    '2021_oss_interested',
    gluval(oss_interested_mask.sum(), num_oss_non_contributors),
    display=False
)
glue(
    '2021_np_interested',
    gluval(np_interested_mask.sum(), num_np_non_contributors),
    display=False
)
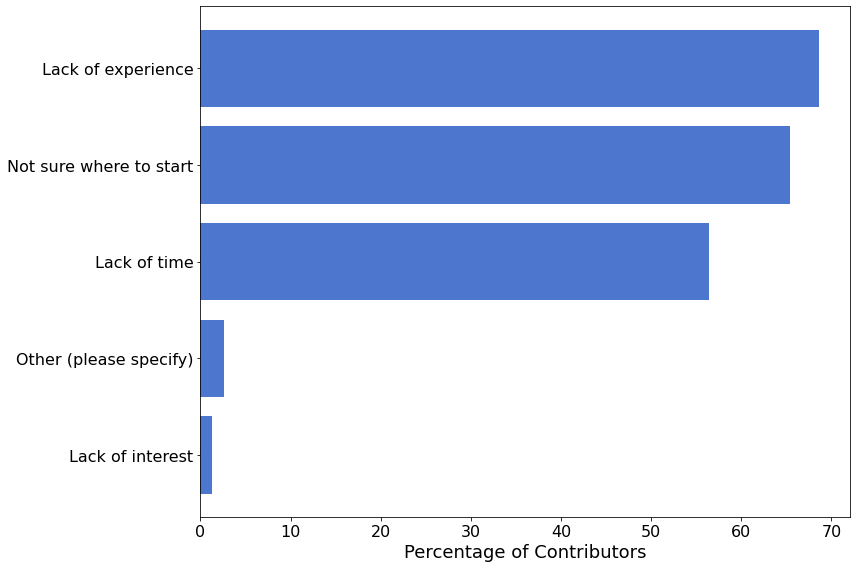
贡献障碍
我们还询问了那些表示有兴趣贡献的受访者,阻止他们这样做的最大障碍是什么。
fig, ax = plt.subplots(figsize=(12, 8))
limitations = ossdata['limitations'][oss_interested_mask]
# Remove non-responses
limitations = limitations[limitations != '']
data = flatten(limitations)
labels, cnts = np.unique(data, return_counts=True)
I = np.argsort(cnts)
labels, cnts = labels[I], cnts[I]
# Plot
ax.barh(np.arange(len(labels)), 100 * cnts / len(limitations))
ax.set_yticks(np.arange(len(labels)))
ax.set_yticklabels(labels)
ax.set_xlabel('Percentage of Contributors')
fig.tight_layout()
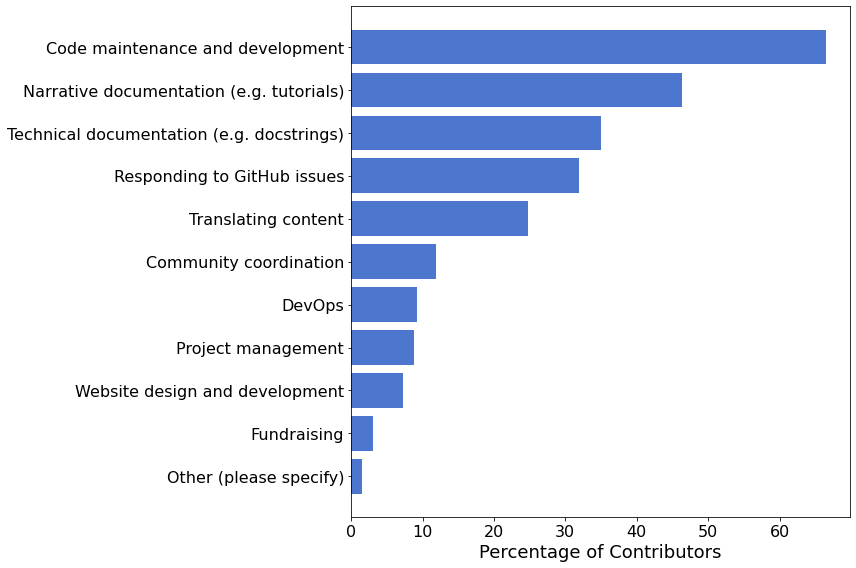
潜在贡献者的兴趣
在表示有兴趣为 NumPy 做出贡献的受访者中,大多数 (66%) 对贡献源代码感兴趣。第二受欢迎的类别是贡献文档,有 113 人 (58%) 受访者表示感兴趣。45 人 (23%) 对贡献叙述性文档(例如教程)和技术文档(例如参考指南)都感兴趣,而 45 人 (23%) 只对叙述性文档感兴趣,23 人 (12%) 只对技术文档感兴趣。
interests = npdata['interests'][np_interested_mask]
interests = interests[interests != '']
data = flatten(interests)
labels, cnts = np.unique(data, return_counts=True)

# NOTE: The labels need a bit of munging here due to the results of the splitting.
# The first two labels are copies of the "Technical documentation" category, thus
# are ignored. The labels corresponding to documentation are also shortened.
labels, cnts = labels[2:], cnts[2:]
labels[3] = 'Narrative documentation (e.g. tutorials)'
labels[-1] = 'Technical documentation (e.g. docstrings)'
I = np.argsort(cnts)
labels, cnts = labels[I], cnts[I]


fig, ax = plt.subplots(figsize=(12, 8))
ax.barh(np.arange(len(labels)), 100 * cnts / len(interests))
ax.set_yticks(np.arange(len(labels)))
ax.set_yticklabels(labels)
ax.set_xlabel('Percentage of Contributors')
fig.tight_layout()

# Highlight top categories
glue('2021_pct_want_contrib_code', f"{100 * cnts[-1] / interests.shape[0]:2.0f}%", display=False)

# Analyze documentation categories based on individual responses
narr_doc_text = "Developing educational content & narrative documentation (e.g. tutorials)"
tech_doc_text = "Writing technical documentation (e.g. docstrings, user guide, reference guide)"
tech_doc_respondents_mask = np.array(
    [tech_doc_text in response for response in interests], dtype=bool
)
narr_doc_respondents_mask = np.array(
    [narr_doc_text in response for response in interests], dtype=bool
)
num_both = np.sum(
    tech_doc_respondents_mask & narr_doc_respondents_mask
)
num_either = np.sum(
    tech_doc_respondents_mask | narr_doc_respondents_mask
)
num_narr_only = np.sum(
    narr_doc_respondents_mask & ~tech_doc_respondents_mask
)
num_tech_only = np.sum(
    tech_doc_respondents_mask & ~narr_doc_respondents_mask
)

glue(
    '2021_interested_in_both_doc_types',
    gluval(num_both, interests.shape[0]),
    display=False,
)
glue(
    '2021_interested_in_either_doc_type',
    gluval(num_either, interests.shape[0]),
    display=False,
)
glue(
    '2021_interested_in_narr_doc_only',
    gluval(num_narr_only, interests.shape[0]),
    display=False,
)
glue(
    '2021_interested_in_tech_doc_only',
    gluval(num_tech_only, interests.shape[0]),
    display=False,
)
- 1
即,在调查时定期贡献。这不包括过去曾定期为项目贡献的贡献者。