用途
fname = "data/2021/numpy_survey_results.tsv"
column_names = [
    'version', 'version_other', 'primary_use','use_freq','components','use_c_ext',
    'using_random', 'bug', 'bug_resolution', 'bug_resolution_other',
    'unsolvable', 'unsolvable_resolution', 'unsolvable_resolution_other',
    'issues','issues_other',
    'deprecation_short', 'deprecation','deprecation_other'
]
featdep_dtype = np.dtype({
    "names": column_names,
    "formats": ['U1024'] * len(column_names),
})

data = np.loadtxt(
    fname, delimiter='\t', skiprows=3, dtype=featdep_dtype,
    usecols=[22,23,24,28,29,30,73,74,75,76,77,78,79,80,81,82,83,84], comments=None, encoding='UTF-16'
)
本节包含各种问题,旨在深入了解新功能采用、问题解决和弃用周期长度等方面。
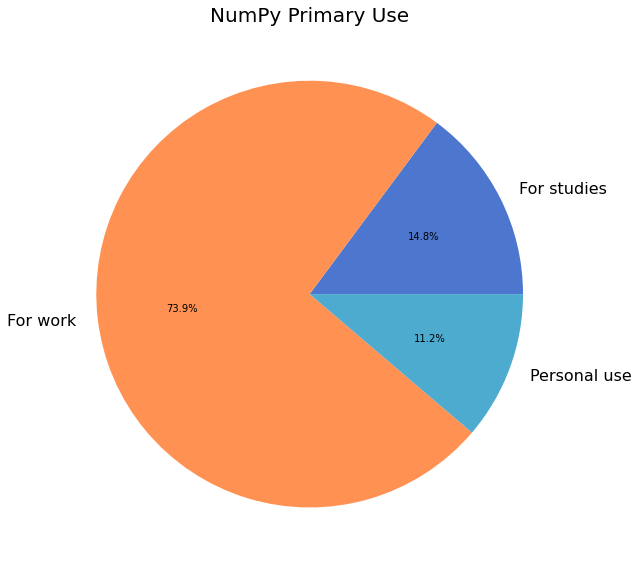
NumPy 主要用途
418 (80%) 的受访者提供了关于他们使用 NumPy 的主要场景的信息。近 3/4 的受访者将 NumPy 用于工作。
uses = data['primary_use'][data['primary_use'] != '']
labels, cnts = np.unique(uses, return_counts=True)

fig, ax = plt.subplots(figsize=(12, 8))
ax.pie(cnts, labels=labels, autopct='%1.1f%%')
ax.set_title("NumPy Primary Use");
fig.tight_layout()

glue(
    '2021_num_primary_use_respondents',
    gluval(uses.shape[0], data.shape[0]),
    display=False
)
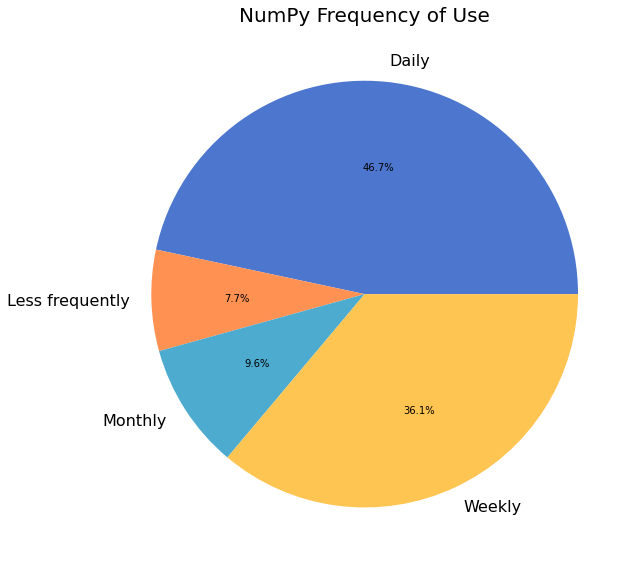
NumPy 使用频率
418 (80%) 的受访者提供了关于他们使用 NumPy 的频率的信息。大多数受访者每天或每周使用 NumPy。
use_freq = data['use_freq'][data['use_freq'] != '']
labels, cnts = np.unique(use_freq, return_counts=True)

fig, ax = plt.subplots(figsize=(12, 8))
ax.pie(cnts, labels=labels, autopct='%1.1f%%')
ax.set_title("NumPy Frequency of Use");
fig.tight_layout()

glue('2021_num_freq_respondents', gluval(use_freq.shape[0], data.shape[0]), display=False)
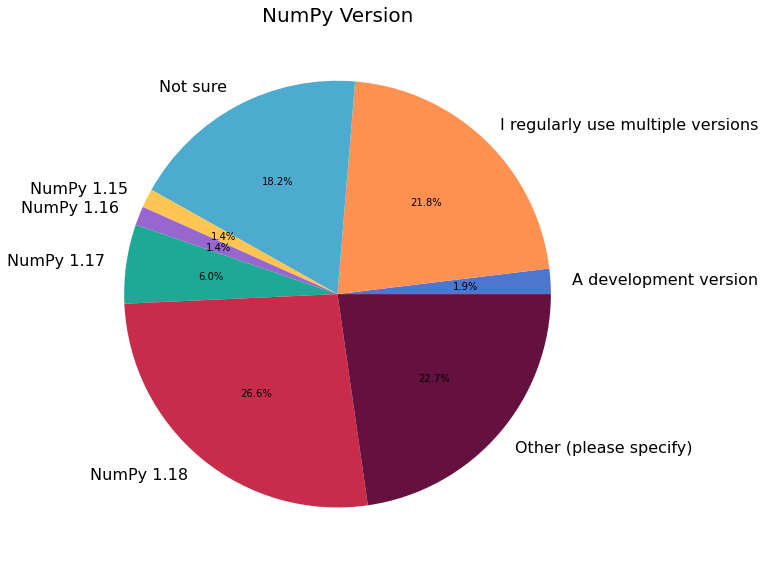
NumPy 版本
在进行调查时,NumPy 1.21 是最新的稳定版本。 50.7 % 的受访者表示他们主要使用旧版本的 NumPy。
vers = data['version'][data['version'] != '']
labels, cnts = np.unique(vers, return_counts=True)

fig, ax = plt.subplots(figsize=(12, 8))
ax.pie(cnts, labels=labels, autopct='%1.1f%%')
ax.set_title("NumPy Version");
fig.tight_layout()

# Percentage of users that use older versions
older_version_usage = 100 * cnts[-8:-2].sum() / cnts.sum()
glue('2021_older_version_usage', f"{older_version_usage:1.1f}", display=False)
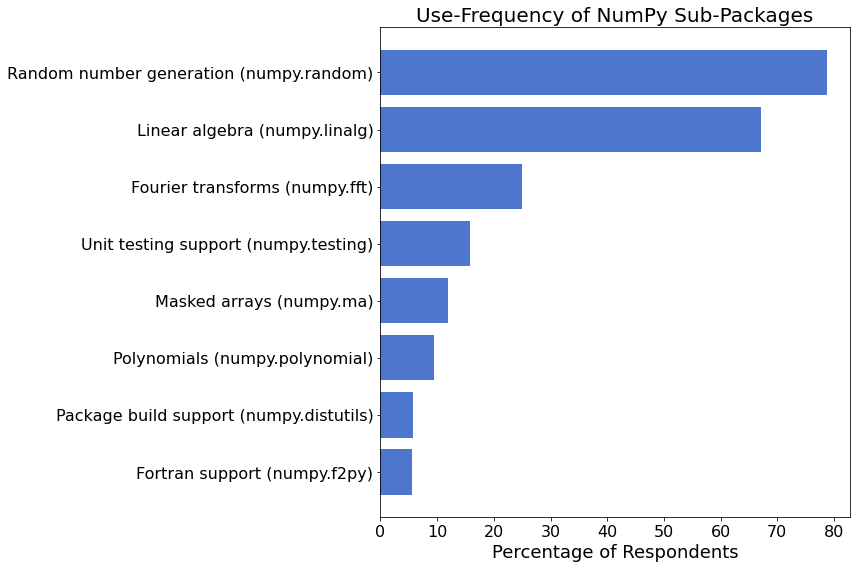
NumPy 组件
NumPy 包含许多用于特定科学计算任务的包,例如随机数生成或傅里叶分析。下图显示了报告使用每个 NumPy 子包的受访者百分比。
components = data['components'][data['components'] != '']
num_respondents = len(components)
# Process components field
all_components = []
for row in components:
    all_components.extend(row.split(','))
all_components = np.array(all_components)
labels, cnts = np.unique(all_components, return_counts=True)
# Descending order
I = np.argsort(cnts)
labels, cnts = labels[I], cnts[I]
cnts = 100 * cnts / num_respondents

fig, ax = plt.subplots(figsize=(12, 8))
ax.barh(np.arange(len(cnts)), cnts, align='center')
ax.set_yticks(np.arange(len(cnts)))
ax.set_yticklabels(labels)
ax.set_xlabel("Percentage of Respondents")
ax.set_title("Use-Frequency of NumPy Sub-Packages")
fig.tight_layout()
NumPy C 扩展
363 (70%) 的参与者分享了他们(或他们的组织)是否通过 NumPy C-API 使用自定义 C 扩展(不包括 Cython)。只有约 7% 的受访者报告使用。
uses_c_ext = data['use_c_ext']
use_c_ext = data['use_c_ext'][data['use_c_ext'] != '']
labels, cnts = np.unique(uses_c_ext, return_counts=True)
labels[0] = 'No response'

fig, ax = plt.subplots(figsize=(8, 8))
ax.pie(cnts, labels=labels, autopct='%1.1f%%')
ax.set_title("Use of NumPy C-Extentions");
fig.tight_layout()

glue('2021_num_c_ext', gluval(use_c_ext.shape[0], data.shape[0]), display=False)

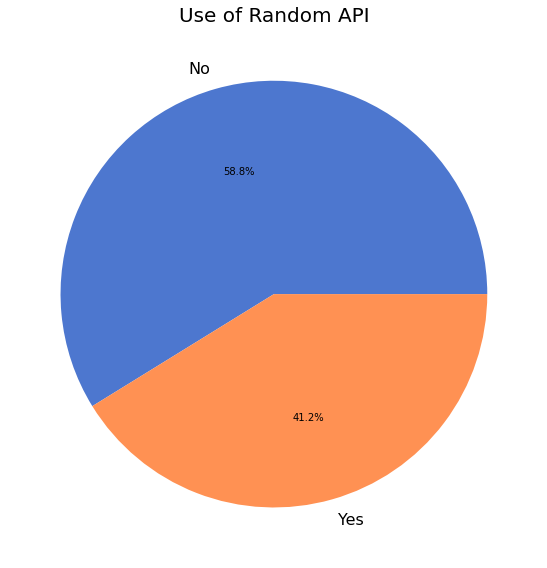
新 numpy.random 采用情况
在版本 1.17 中,为 numpy.random 添加了 新的随机数生成 API。我们询问了调查参与者是否正在使用新的随机 API。在 522 名调查参与者中,有 233 (45%) 人分享了他们是否正在使用新的 random API。
rand = data['using_random'][data['using_random'] != '']
labels, cnts = np.unique(rand, return_counts=True)

fig, ax = plt.subplots(figsize=(8, 8))
ax.pie(cnts, labels=labels, autopct='%1.1f%%')
ax.set_title("Use of Random API");
fig.tight_layout()

glue(
    '2021_num_random_users',
    gluval(rand.shape[0], data.shape[0]),
    display=False
)
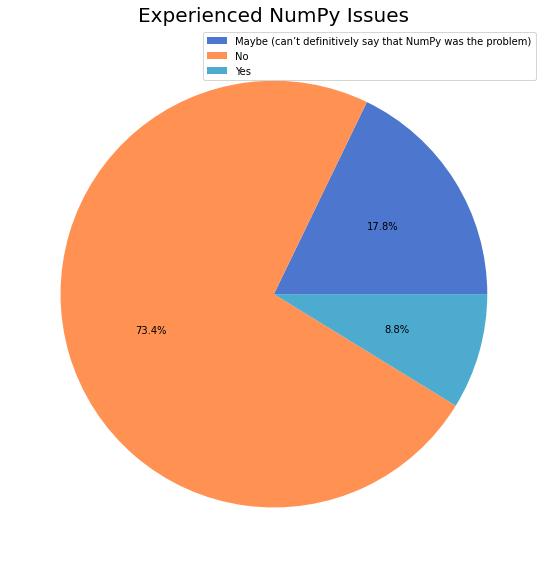
问题处理
我们想了解用户在使用 NumPy 时遇到问题的频率,因此我们提出了以下问题:
在过去一年中,您编写的代码是否因 NumPy 的问题而出现过问题?
在 522 名调查参与者中,有 331 (63%) 人回答了这个问题。
bug = data['bug'][data['bug'] != '']
labels, cnts = np.unique(bug, return_counts=True)

fig, ax = plt.subplots(figsize=(8, 8))
ax.pie(cnts, labels=labels, autopct='%1.1f%%', labeldistance=None)
ax.legend()
ax.set_title("Experienced NumPy Issues");
fig.tight_layout()

glue(
    '2021_bug_reporters',
    gluval(bug.shape[0], data.shape[0]),
    display=False,
)
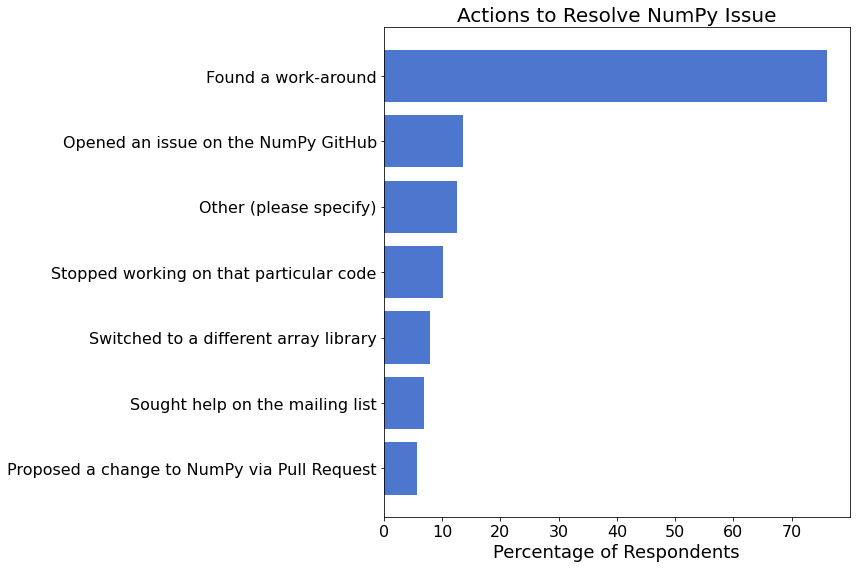
我们询问了那些报告遇到问题的人,他们采取了哪些行动来解决问题。
bug_resolution = data['bug_resolution'][data['bug_resolution'] != '']
labels, cnts = np.unique(flatten(bug_resolution), return_counts=True)
I = np.argsort(cnts)
labels, cnts = labels[I], cnts[I]

fig, ax = plt.subplots(figsize=(12, 8))
ax.barh(
    np.arange(len(labels)),
    100 * cnts / bug_resolution.shape[0],
    tick_label=labels,
)
ax.set_xlabel('Percentage of Respondents')
ax.set_title("Actions to Resolve NumPy Issue");
fig.tight_layout()
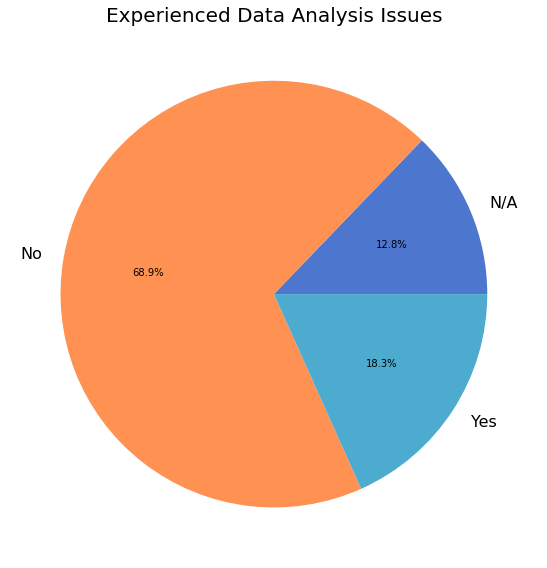
使用 NumPy 进行数据分析
与 上一个问题 类似,我们试图了解 NumPy 在多大程度上满足了用户的数据分析需求。我们提出了以下问题:
在过去一年中,您是否遇到过一个无法使用 NumPy 解决的涉及数值数据的难题?
在 522 名调查参与者中,有 328 (63%) 人回答了上述问题,其中 60 (18%) 人报告说他们遇到了一个最初期望能用 NumPy 解决但最终未能解决的问题。
unsolvable = data['unsolvable'][data['unsolvable'] != '']
labels, cnts = np.unique(unsolvable, return_counts=True)
num_yes = np.sum(unsolvable == 'Yes')

fig, ax = plt.subplots(figsize=(8, 8))
ax.pie(cnts, labels=labels, autopct='%1.1f%%')
ax.set_title("Experienced Data Analysis Issues");
fig.tight_layout()

glue(
    '2021_num_solvers',
    gluval(unsolvable.shape[0], data.shape[0]),
    display=False,
)
glue(
    '2021_num_unsolved',
    gluval(num_yes, unsolvable.shape[0]),
    display=False
)
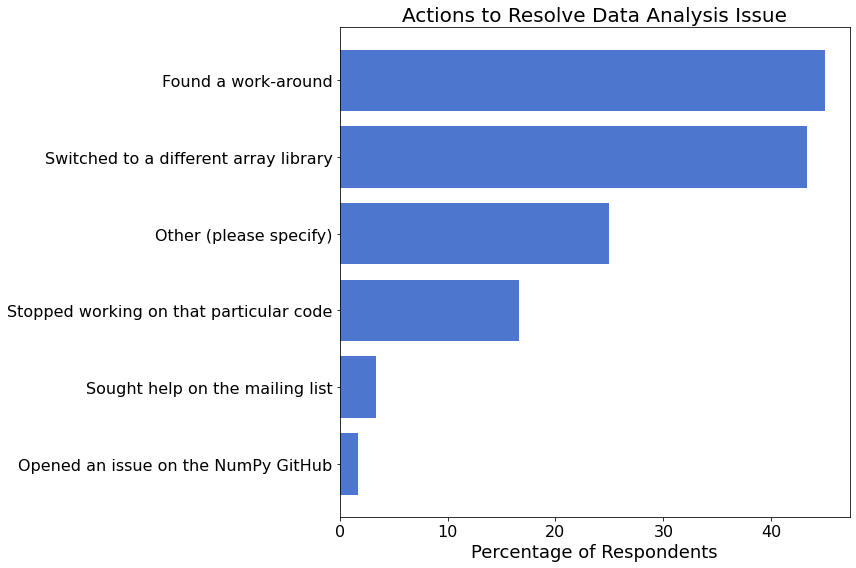
我们询问了对上一个问题回答“是”的人,他们采取了哪些行动来解决问题。
resolution = data['unsolvable_resolution'][data['unsolvable'] == 'Yes']
resolution = resolution[resolution != '']
labels, cnts = np.unique(flatten(resolution), return_counts=True)
I = np.argsort(cnts)
labels, cnts = labels[I], cnts[I]

fig, ax = plt.subplots(figsize=(12, 8))
ax.barh(
    np.arange(len(labels)),
    100 * cnts / resolution.shape[0],
    tick_label=labels,
)
ax.set_xlabel('Percentage of Respondents')
ax.set_title("Actions to Resolve Data Analysis Issue");
fig.tight_layout()
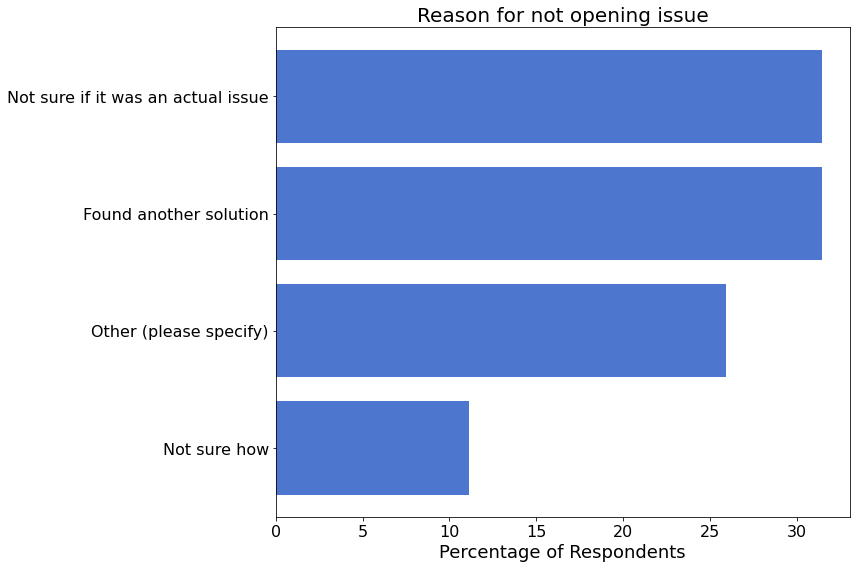
开启问题
54 (10%) 的受访者报告说遇到过一个无法使用 NumPy 解决的数值数据问题,但没有开启相关问题。然后,我们询问了他们未开启问题的原因。
open_issues = data['issues'][data['issues'] != '']
labels, cnts = np.unique(flatten(open_issues), return_counts=True)
I = np.argsort(cnts)
labels, cnts = labels[I], cnts[I]

fig, ax = plt.subplots(figsize=(12, 8))
ax.barh(
    np.arange(len(labels)),
    100 * cnts / open_issues.shape[0],
    tick_label=labels,
)
ax.set_xlabel('Percentage of Respondents')
ax.set_title("Reason for not opening issue");
fig.tight_layout()

glue(
    '2021_num_open_issues',
    gluval(open_issues.shape[0], data.shape[0]),
    display=False,
)
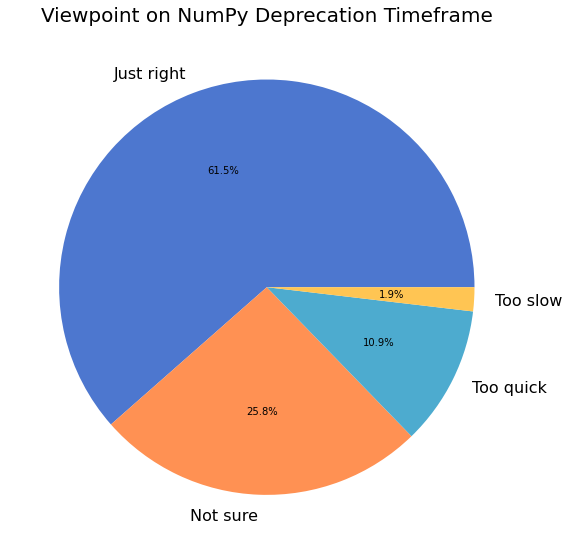
弃用时间表
我们请调查参与者分享他们对 NumPy 弃用周期的看法,具体是:
NumPy 通常有一个发布周期(1 年)的弃用政策。您认为这是否……
在 522 名调查参与者中,有 322 (62%) 人回答了这个问题。
current_dep = data['deprecation_short'][data['deprecation_short'] != '']
labels, cnts = np.unique(current_dep, return_counts=True)

fig, ax = plt.subplots(figsize=(8, 8))
ax.pie(cnts, labels=labels, autopct='%1.1f%%')
ax.set_title("Viewpoint on NumPy Deprecation Timeframe");
fig.tight_layout()

glue(
    '2021_num_dep_short',
    gluval(current_dep.shape[0], data.shape[0]),
    display=False
)
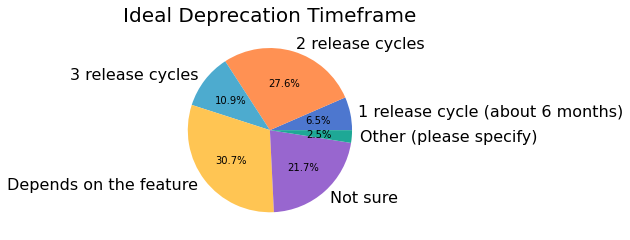
我们还问道:
您认为什么样的弃用时间周期是好的?
在 522 名调查参与者中,有 322 (62%) 人回答了这个问题。
depcycle = data['deprecation'][data['deprecation'] != '']
labels, cnts = np.unique(depcycle, return_counts=True)

fig, ax = plt.subplots(figsize=(8, 8))
ax.pie(cnts, labels=labels, autopct='%1.1f%%')
ax.set_title("Ideal Deprecation Timeframe");
fig.tight_layout()

glue(
    '2021_dep_opinions',
    gluval(depcycle.shape[0], data.shape[0]),
    display=False
)